Loading
Loading
At 3Li Global, we transform your organization's data into a powerful decision-making engine. Our analytics and business intelligence solutions encompass interactive dashboards, predictive models, KPI tracking frameworks, and real-time reporting — enabling leadership teams across the UAE and Saudi Arabia to act on insight rather than instinct.
Explore Analytics SolutionsMost organizations collect vast amounts of data but lack the tools, architecture, and expertise to extract meaningful intelligence from it — leaving strategic decisions to guesswork and outdated reports.
goes unused for analytics, meaning organizations make critical decisions based on incomplete information and gut instinct.
Critical business data is trapped in disconnected systems — CRMs, spreadsheets, ERPs, and legacy databases — making it impossible to get a unified view of performance or customers.
Teams wait days or weeks for reports from IT or analysts. By the time insights arrive, market conditions have shifted and the window for action has closed.
Without predictive capabilities, leadership reacts to problems after they occur rather than anticipating trends — resulting in missed revenue opportunities and preventable losses.
Mission-critical decisions rely on manually maintained spreadsheets prone to version conflicts, formula errors, and security gaps — creating a fragile foundation for enterprise strategy.
Measurable results our analytics and BI solutions deliver for organizations across the Middle East.
Reduction in time from data request to actionable insight delivery
Average revenue increase driven by data-informed decision making
Improvement in data consistency and reporting accuracy
Production dashboards deployed across industries in the region
Comprehensive historical analysis that transforms past performance data into clear, actionable narratives — giving stakeholders a definitive picture of what happened and why across every business function.
Machine learning and statistical models that anticipate future trends, customer behavior, and market shifts — empowering proactive decision-making and strategic resource allocation.
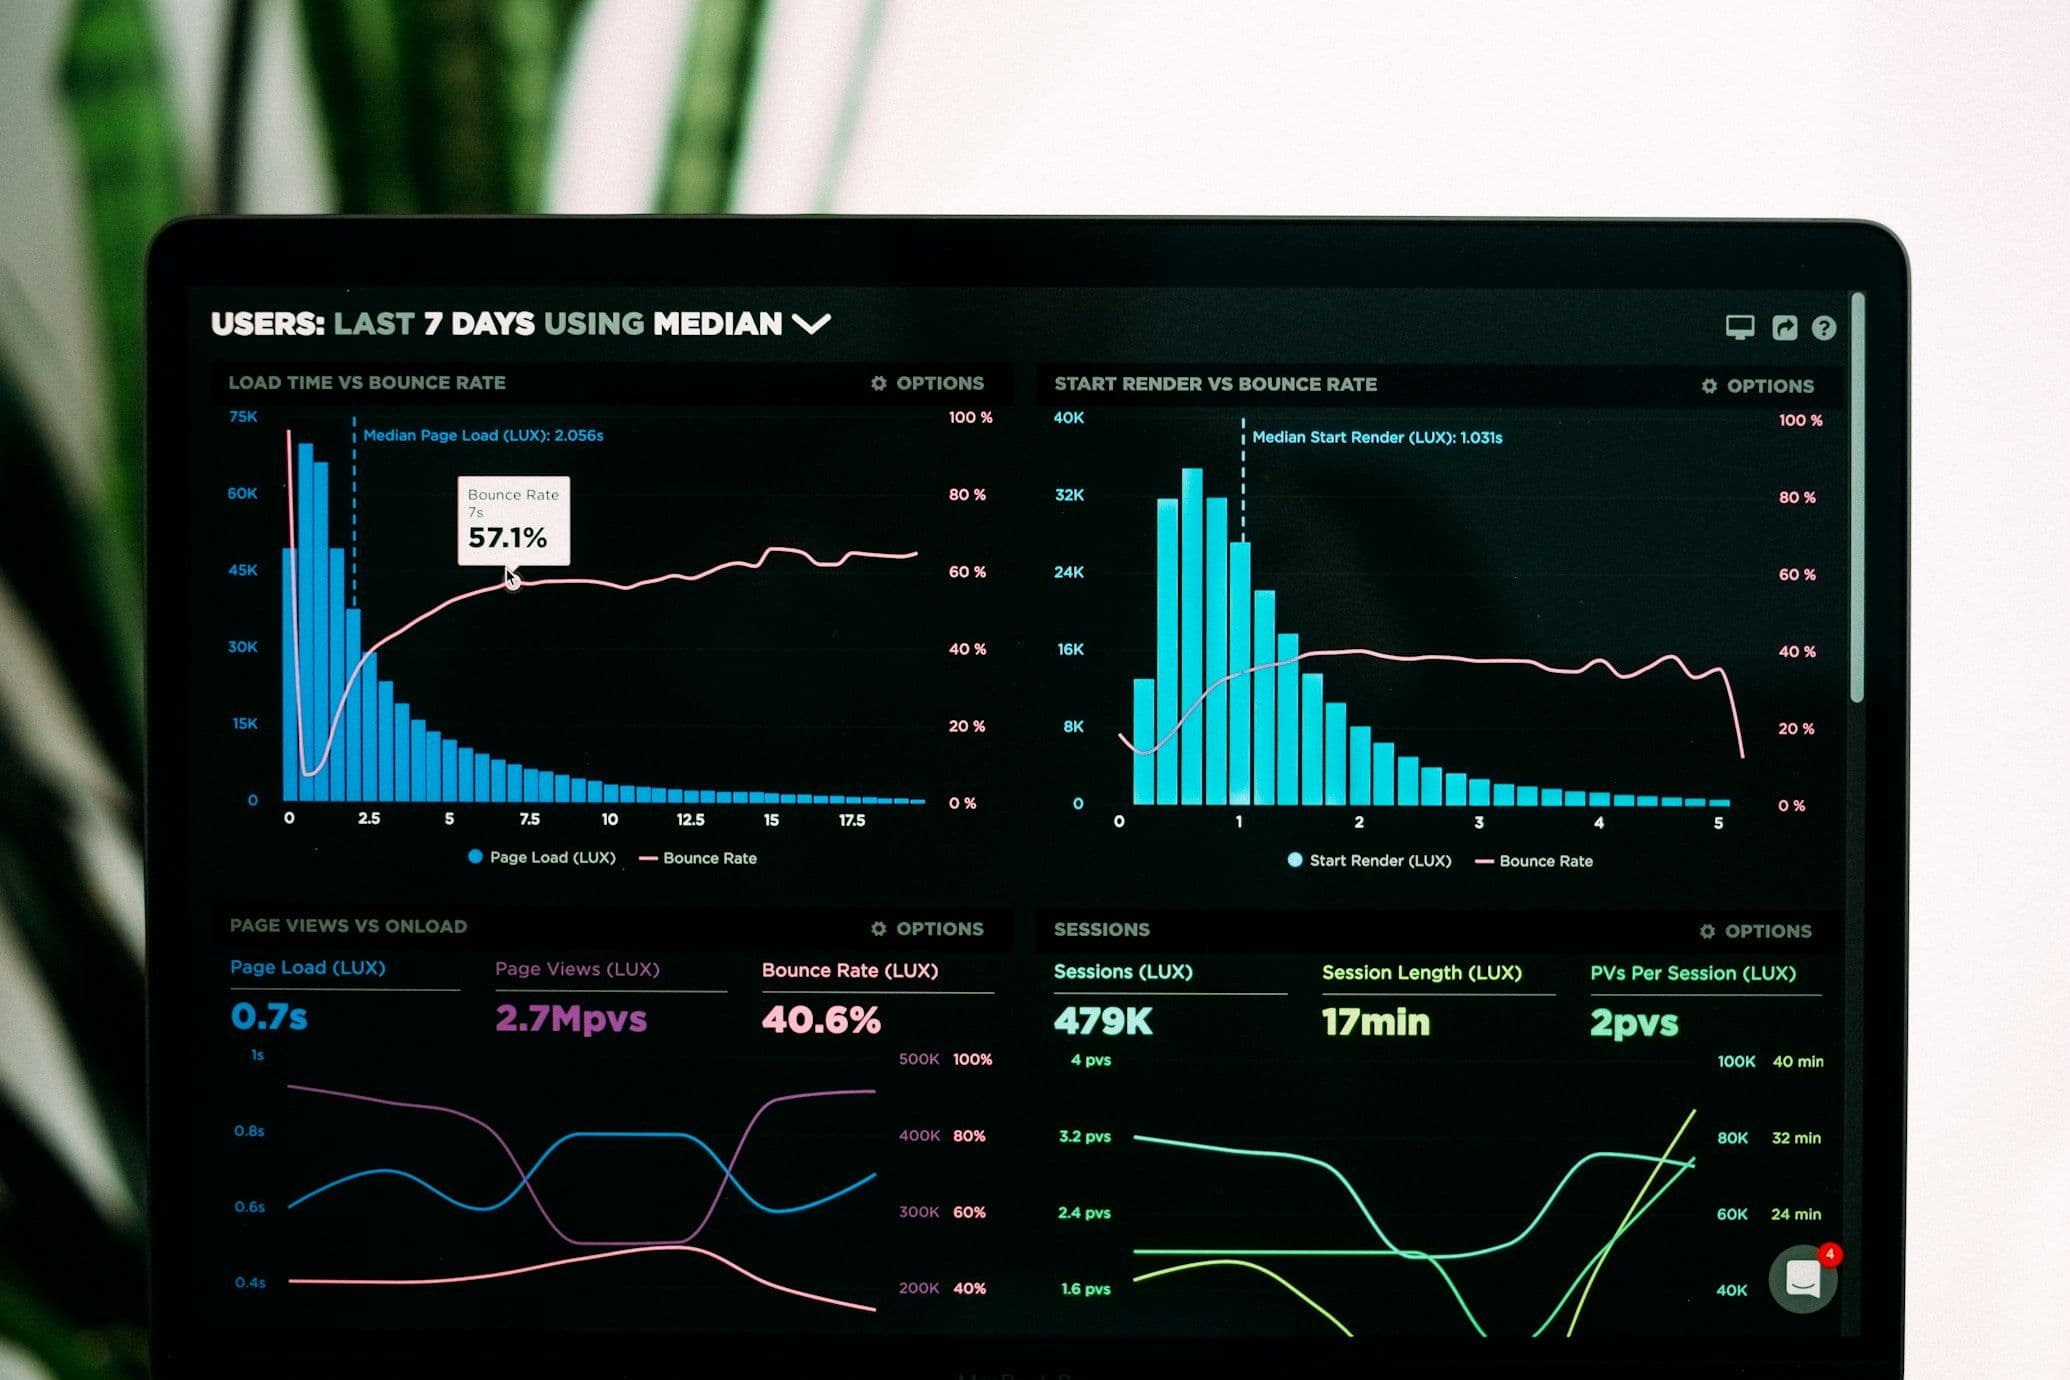
Interactive, visually compelling dashboards that translate complex datasets into intuitive charts, graphs, and drill-down views — making data accessible to every stakeholder from C-suite to front line.
Structured frameworks for defining, measuring, and monitoring key performance indicators — aligning teams around shared metrics and driving accountability at every organizational level.
Empowering business users to explore data, build reports, and uncover insights independently — reducing dependency on IT teams while maintaining governance and data quality standards.
Unified data architectures that consolidate information from CRMs, ERPs, marketing platforms, and operational systems into a single source of truth for reliable, consistent analytics.
We are certified experts across the leading BI and analytics platforms, selecting the right technology stack to match your data maturity, infrastructure, and business goals.
Microsoft's enterprise-grade business intelligence platform that transforms raw data into stunning interactive visualizations. Seamlessly integrated with the Microsoft ecosystem including Azure, Dynamics 365, and Microsoft 365 for unified enterprise analytics.
A structured, six-phase methodology that transforms scattered data into a governed analytics ecosystem — delivering measurable business value at every stage.
We map your entire data landscape — sources, quality, gaps, and governance — to understand what you have, where it lives, and how it flows across systems. This audit reveals the true state of your data readiness.
Working with your leadership team, we define the KPIs, metrics, and success criteria that matter most — aligning analytics initiatives with revenue goals, operational targets, and strategic objectives.
We design and build the data pipelines, warehouses, and semantic models that consolidate your fragmented data into a single source of truth — clean, governed, and optimized for fast querying.
Our visualization specialists craft interactive dashboards and automated reports tailored to each stakeholder group — from executive scorecards to operational drill-down views with real-time data refresh.
We train your teams to explore data independently, build their own reports, and interpret insights with confidence — transforming analytics from an IT function into an organization-wide capability.
Post-launch, we continuously refine dashboards, optimize query performance, add predictive models, and expand analytics coverage — ensuring your BI investment compounds in value over time.
End-to-end analytics and BI solutions tailored to your business — from executive dashboards and predictive models to self-service platforms and automated reporting.
We design role-specific executive views with automated data refresh, conditional formatting for threshold alerts, trend sparklines, and drill-through navigation to underlying detail — all optimized for both desktop and mobile.
Pipeline velocity tracking, deal stage conversion analysis, quota attainment dashboards, product mix profitability, and AI-powered revenue forecasting integrated with your CRM platform.
RFM segmentation, cohort analysis, NPS and CSAT tracking dashboards, customer acquisition cost analysis, and predictive churn scoring with automated re-engagement triggers.
SLA compliance tracking, process cycle time analysis, resource utilization heatmaps, quality control dashboards, and predictive maintenance alerting for equipment and infrastructure.
Profit and loss statements, balance sheet dashboards, cash flow forecasting, budget variance analysis, and regulatory compliance reports — all automated with scheduled delivery and audit trails.
White-label analytics portals, industry-specific KPI frameworks for healthcare, retail, real estate, and logistics, embedded BI components for SaaS products, and custom data storytelling applications.
Common questions about implementing analytics and business intelligence for your organization.
Business intelligence focuses on descriptive reporting — what happened and what is happening now — through dashboards, visualizations, and standardized reports. Business analytics goes deeper, using statistical models and predictive techniques to explain why something happened and forecast what will happen next. We deliver both capabilities as an integrated solution.
A focused BI implementation typically takes 6-10 weeks from discovery to production dashboards. This includes data audit, KPI definition, data integration, dashboard development, and user training. Enterprise-wide analytics transformations involving multiple departments and data warehousing may take 3-6 months.
The right platform depends on your existing technology stack, data volume, user skill level, and budget. Power BI excels in Microsoft-centric environments, Tableau leads in visual analytics and data exploration, Looker is ideal for cloud-native organizations, and QuickSight suits AWS-heavy architectures. We assess your needs and recommend the optimal fit.
Absolutely. We specialize in connecting BI platforms with Salesforce, HubSpot, Microsoft Dynamics, SAP, Oracle, and custom systems. Our data integration layer pulls information from multiple sources into a unified data model, ensuring your dashboards reflect a complete and accurate picture of your business.
No. We design dashboards with business users in mind, not data engineers. Our self-service BI implementations include intuitive interfaces, natural language query capabilities, and guided analytics workflows. We also provide hands-on training to ensure your teams can explore data and build basic reports independently.
Security is built into every layer. We implement row-level security, role-based access controls, data masking for sensitive fields, audit logging, and compliance with regional data residency requirements including UAE and KSA regulations. Our governance frameworks ensure data quality, consistency, and appropriate access at all times.

In a market where customer relationships define success, technology is no longer optional, but it’s ...
The manufacturing world has evolved at an unprecedented rate. Today, building a great product is no...

Recall you would only type in a customer’s name, and add a few notes in CRM, and that was all, but t...

In a market where every customer interaction counts, generating leads is not the hardest part anymor...

In sales, time is one of your most valuable tools. The more time your team spends on manual tasks li...

...
In a market where every customer interaction counts, generating leads is not the hardest part anymore; keeping them enga...
Book a free analytics consultation with our BI experts. We will assess your current data landscape, identify the highest-impact dashboards and reports for your business, and outline a clear roadmap to becoming a truly data-driven organization.
